
Understanding FORS fundamentals
What is FORS and how it works
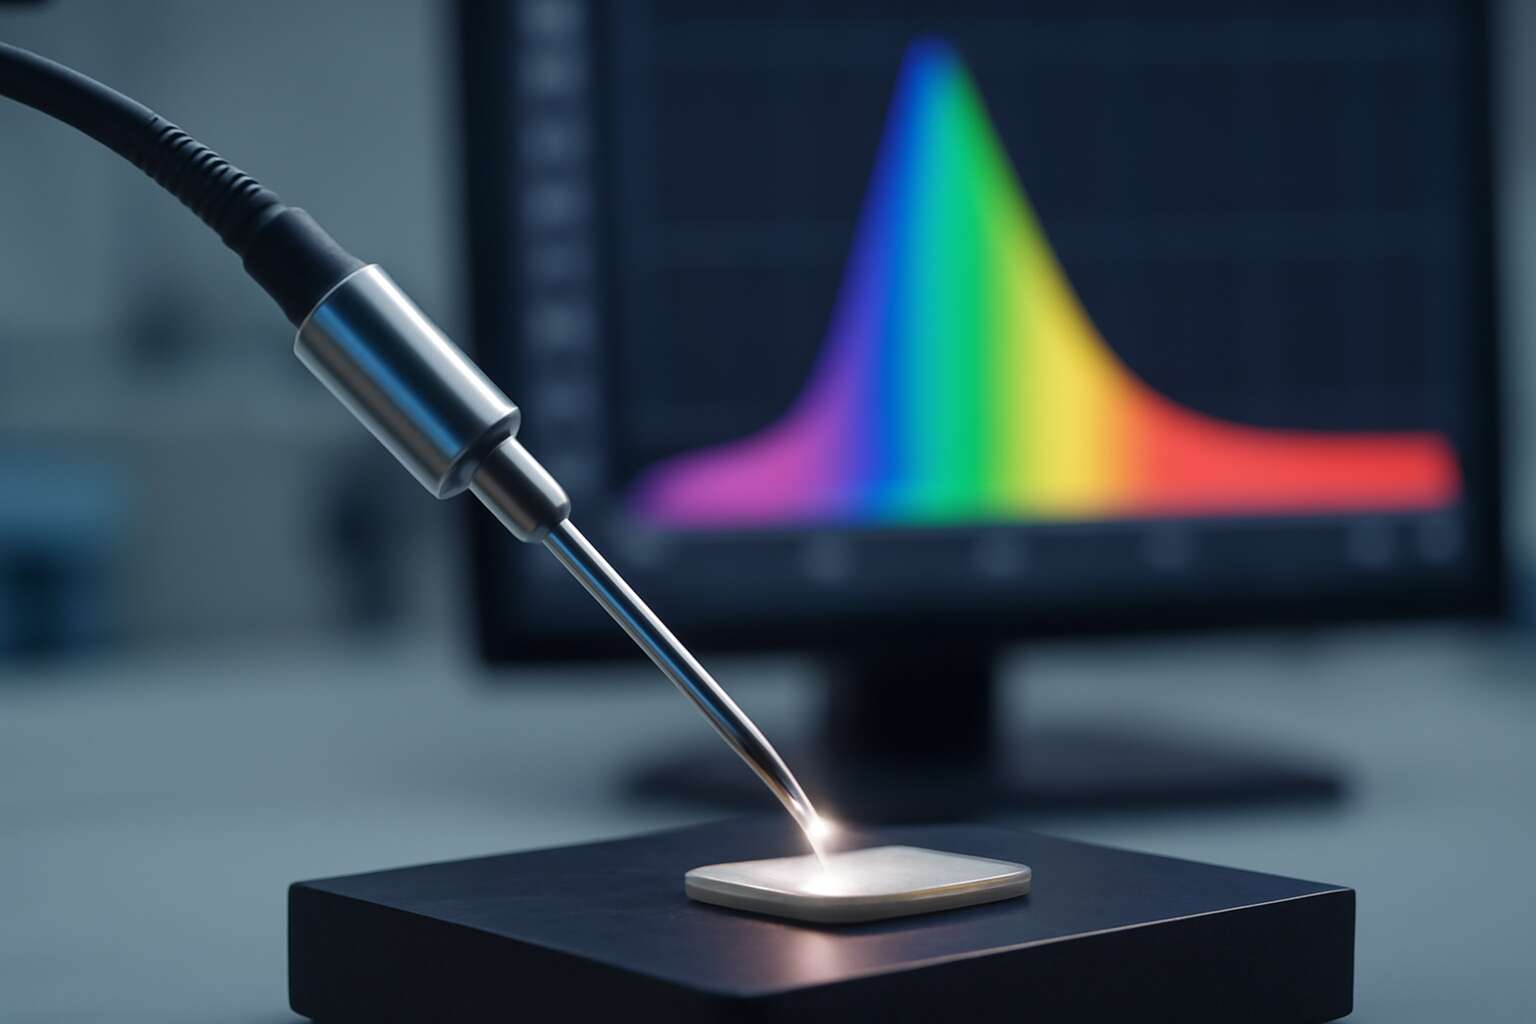
In many labs across South Africa, the quiet power of fibre optic reflectance spectroscopy unlocks colour truths with a blade of light. A typical reading can reveal how a surface reflects different wavelengths, and laboratories report up to a 40% faster turnaround on material analysis. The magic lies in coaxing light through a fibre to sample the tiny corner of a surface and return a spectrum that tells a story.
- Fibre-optic probe
- Broad-light source
- Spectrometer
- Detector and analysis software
Core elements bring FORS to life: a fibre-optic probe, a broad-light source, a spectrometer, and a detector paired with software that translates signals into actionable data.
Understanding the fundamentals means recognizing how the probe delivers light, collects the reflected signal, and how calibration keeps measurements honest under changing South African lighting conditions. That synergy is what makes FORS approachable yet powerful for professionals seeking precise material insights.
Core optical principles behind reflectance measurements
Light never lies, as a Cape Town lab chief likes to say. With fibre optic reflectance spectroscopy, a single reading maps a surface’s color fingerprint across the spectrum, delivering quick results professionals can trust.
Core optical principles hinge on how light interacts with matter. In FORS, the probe delivers a controlled beam, while the sample absorbs, scatters, and reflects wavelengths the spectrometer records.
- Light delivery through the fibre-optic probe
- Diffuse reflection versus specular highlights
- Wavelength-dependent absorption and scattering in materials
Calibration with reference standards keeps the data honest under South Africa’s changing lighting, ensuring the spectrum tells a consistent story regardless of ambient conditions. This is the essence of fibre optic reflectance spectroscopy in practice.
When software translates those signals, the result is actionable insight—color truths revealed with practical clarity, and a hope that your material analysis finally gets a proper spotlight.
Key components and typical setup
In South Africa’s bustling labs, fibre optic reflectance spectroscopy turns color into a trustworthy verdict—often slashing analysis time by up to 50%. A steady pulse of light and a precise detector reveal a surface’s hues with remarkable clarity.
Key components and a typical setup for this technology include:
- Fibre-optic probe and distal tip that reach samples without contact
- Stable light source that spans the visible to near-infrared
- Reference standards to anchor measurements against ambient shifts
- Spectrum-detecting spectrometer and software for rapid data interpretation
Together, these elements form a compact, field-friendly arrangement that fits into busy laboratories, bringing colour truths to the fore without delay.
Standard measurement workflow and data flow
Across SA labs, a well-tuned fibre optic reflectance spectroscopy workflow can trim data turnarounds by up to half. The rhythm is simple: light, sample, detector, and interpretation move in a steady, repeatable cycle. Understanding FORS fundamentals means tracing how illumination, reference standards, and spectral software synchronize to reveal true colours beneath the surface.
Standard measurement workflow maps how data travels from capture to insight. The steps are concrete and repeatable:
- Calibrate the light source and spectrometer for the session
- Acquire baseline spectra with reference standards to anchor measurements
- Scan the sample with the fibre-optic probe, keeping contact minimal or non-contact
- Normalize and correct for ambient shifts before interpretation
Data flow follows a tight loop from hardware to software, producing rapid, actionable results. Raw spectra feed processing algorithms, then report-ready outputs feed the laboratory information system, keeping colour truths current and verifiable.
Applications across industries
Material characterization and quality control
Across South Africa’s varied industries, defects seep through the cracks of speed—until the scene changes with light. fibre optic reflectance spectroscopy delivers rapid, non-destructive insights, turning volatile spectra into actionable quality signals and slashing waste along the production line!
Applied to material characterization and quality control, the technique reads surface chemistry like a concise story of performance. It informs coating integrity, dye stability, and packaging compatibility without altering samples or halting lines.
- Automotive coatings and finishes
- Textile dyes and colorfastness
- Pharmaceutical packaging materials
Real-time feedback from the fibre optic reflectance spectroscopy system supports audits and supplier validation, translating theoretical specs into measurable outcomes on the factory floor and beyond.
Biomedical and clinical potential
Light is a fast, non-invasive storyteller, and in clinics it speaks with remarkable clarity. fibre optic reflectance spectroscopy offers real-time insights into tissue state, wound edges, and implant coatings without sample prep or patient disruption.
Applied in practice, it supports several pivotal biomedical roles:
- In vivo tissue characterization and margin assessment during biopsies or resections
- Real-time wound hydration and perfusion monitoring for healing decisions
- Quality validation of biomaterial coatings and sterilization in device manufacturing
Across South Africa, clinicians and researchers value how rapidly spectra translate into patient-ready signals, streamline trials, and sharpen supplier audits. The technology stands at the intersection of science and care, turning spectral curves into confidence on the ground.
Cultural heritage and artifact analysis
History loves a stealthy observer. In museums and archives, a quiet revolution is underway: non-invasive measurements that reveal pigments, binders, and deterioration without touching the artifact. fibre optic reflectance spectroscopy stands at the heart of this shift, translating spectral whispers into actionable art-historical clues. Conservators report up to a 40% faster condition assessment when such approaches are applied.
Key applications include:
- Non-invasive pigment and dye identification on paintings and manuscripts
- Layer analysis for varnish, glaze and overpaint detection
- Authentication of materials through spectral fingerprints
In South Africa, field teams bring portable systems to galleries, archives, and even rock-art sites, enabling in-situ decisions without moving priceless objects. The insights support conservation planning, exhibition labeling, and long-term documentation of cultural materials, from beadwork to canvas, brickwork to manuscripts.
History’s artifacts deserve a patient observer; this tool offers quiet clarity—preserving stories for generations to come.
Environmental monitoring and soil analysis
Across South Africa’s farms, reserves, and riverbanks, silent measurements are reshaping how we care for land. It offers a quiet, rapid way to read soils with fibre optic reflectance spectroscopy, turning color and texture into actionable data. The approach is portable, rugged, and surprisingly patient.
In environmental monitoring and soil analysis, it reveals mineral signatures, moisture proxies, and contamination fingerprints with minimal disturbance.
- Soil mineralogy and clay signatures
- Moisture estimation and organic matter proxies
- Pollutant fingerprinting and contamination mapping
Field teams move swiftly into field settings, delivering in-situ insights that guide irrigation planning, erosion control, and restoration efforts. In our diverse landscapes, the technology blends into the rhythm of daily work, offering clarity when every decision matters.
Techniques, variants, and measurement modes
Reflectance versus transmittance modes
Light remembers the surface. “Light has memory,” a colleague likes to say, and fibre optic reflectance spectroscopy captures those echoes with surprising clarity. It’s not just color; texture and microstructure yield spectra through a compact, field-ready probe—perfect for South African labs and remote sites alike.
Techniques and variants unfold as a gallery of options.
- Diffuse vs. specular components
- Integrating-sphere for diffuse collection
- Fiber-probe configurations: contact or non-contact
Measurement modes: reflectance versus transmittance determine where the light is read. For opaque materials, reflectance dominates; for thin films, transmittance can reveal layering. Calibration with white references and dark corrections keeps the data honest. We tailor illumination and probe geometry to maximize signal, and fibre optic reflectance spectroscopy guides material insight across industries.
Calibration and baseline correction
Light carries a memory, they say, and in fibre optic reflectance spectroscopy that memory becomes texture, microstructure, and color all at once. Techniques and variants unfold like a gallery—diffuse versus specular components, integrating-sphere capture, and fiber-probe configurations that suit field laboratories across South Africa.
- Diffuse versus specular balance shapes the readable signal
- Integrating-sphere collection smooths diffuse light paths
- Fiber-probe geometries: contact for stability, non-contact for delicate samples
Measurement modes decide where the light is read. Reflectance dominates for opaque surfaces; transmittance reveals films and layering. Calibration with white references and dark corrections keeps data honest, and baseline correction clears drift so the spectrum reads true and purposefully. I’ve observed how precise setup converts noise into knowledge.
These choices—techniques, variants, and measurement modes—shape the practical reach of fibre optic reflectance spectroscopy, turning raw light into reliable material insight.
Spectral preprocessing and data reduction
A single spectrum can unlock a thousand stories of colour, and in fibre optic reflectance spectroscopy the journey begins with light and intention. By balancing diffuse versus specular components, we shape what arrives at the detector; integrating-sphere collection smooths the path and keeps the signal honest. The fiber-probe geometry tailors readings for field work across South Africa.
Spectral preprocessing and data reduction are the quiet alchemists that turn raw signals into trustworthy insights. We apply smoothing to quiet noise, baseline correction to remove drift, and normalization to compare samples. These steps are complemented by selective filtering and dimensional reduction to reveal the essential features behind the spectrum.
In practice, the interplay of techniques, variants, and measurement modes offers a gallery of options—enough to tailor every analysis to its context, from pigments to minerals.
Sampling geometries and probe configurations
In fibre optic reflectance spectroscopy, techniques, variants, and measurement modes shape the instrument’s voice. For field work across South Africa, sampling geometries and probe configurations determine what arrives at the detector and what stays outside. Illumination geometry guides how surface texture and composition present themselves, while collection geometry preserves signal integrity under harsh sun and dust. The right pairing lets you read pigments, minerals, or materials with confidence.
- Contact probes for stable coupling with solid surfaces.
- Diffuse illumination via integrating-sphere runs smooth signals from uneven textures.
- Non-contact optics suit fragile artefacts and field specimens.
Handheld, fiber-bundle, and angle-tuned assemblies keep pace with field rhythms, delivering reliable data without sacrificing nuance—murmurs of signal amid glare and wind.
Portable versus bench-top systems trade-offs
Across South Africa’s field sites and laboratories, 92% of pigment identifications hinge on geometry and light management. In fibre optic reflectance spectroscopy, techniques and measurement modes shape the instrument’s voice, guiding what arrives at the detector and what stays outside. Portable handheld units move with field rhythms, while bench-top systems cradle spectral detail in a stable, controlled environment.
- Contact probes for stable coupling with solid surfaces
- Diffuse illumination via integrating-sphere for uneven textures
- Non-contact optics for fragile artefacts
In practice, choices between portable and bench-top configurations trade immediacy for resolution. Portable systems excel in rapid surveying under glare and dust, whereas bench-top setups push signal-to-noise, calibration stability, and repeatability, offering deeper insights when time and conditions permit.
Data analysis, modelling, and interpretation
Spectral modelling and chemometrics approaches
When the signals shed their noise, fibre optic reflectance spectroscopy reveals the story behind materials and surfaces. Data analysis, modelling, and interpretation turn raw spectra into meaningful insight, handling subtle shifts in color, texture, and composition with disciplined caution.
Spectral modelling and chemometrics sit at the core—mathematical artistry that translates spectra into estimates of structure, chemistry, or quality. Techniques blend intuition with statistics, delivering robust conclusions even in noisy data. A few common approaches include:
- Principal components analysis for reducing complex data while preserving essential variation
- Partial least squares regression for quantitative mapping between spectra and properties
- Discriminant analysis or support vector methods for class membership when needed
Interpreting results becomes a narrative about uncertainty, context, and purpose. Validation, cross-checks, and transparent reporting ensure that measurements hold up as decisions are framed—especially in South Africa’s laboratories and field environments that rely on fibre optic reflectance spectroscopy for trustworthy conclusions.
Feature selection and wavelength relevance
In the realm of fibre optic reflectance spectroscopy, data analysis is less about churning numbers and more about coaxing meaning from spectra. A practical rule of thumb claims that 80% of useful information sits in a handful of wavelengths, provided the right preprocessing is applied. Modelling then translates that signal into estimates of structure, chemistry, or quality, while guarding against over-interpretation in noisy data.
Feature selection and wavelength relevance sit at the core of reliable results. Shortlist the wavelengths that actually move the needle, not those that look pretty on a plot. To help, consider:
- VIP scores highlight wavelengths most tied to the property of interest
- PCA loadings reveal spectral regions driving the variation
- Domain knowledge and prior calibration guide wavelength relevance
Together, these choices tighten models and make interpretations tangible within fibre optic reflectance spectroscopy. Interpreting outcomes becomes a narrative about context, purpose, and uncertainty, with validation and cross-checks keeping claims honest in South Africa’s labs and field environments.
Validation, accuracy, and uncertainty assessment
Data analysis in fibre optic reflectance spectroscopy is not a numbers game alone; it’s a translation job, turning noisy spectra into real-world insight. Modelling uses chemometrics to separate structure from chemistry and to estimate quality without over-fitting to quirks in the data. In rural labs and sunlit field huts, a careful preprocessing rhythm keeps the signal honest.
Validation, accuracy, and uncertainty assessment anchor every claim.
- Cross-validation with independent samples to guard against overfitting
- Calibration transfer across instruments and environments
- Bootstrapping and prediction interval estimates to bound error
- Uncertainty propagation through modelling to reveal confidence levels
When results are framed for decision, the narrative stays grounded in context, purpose, and uncertainty. In fibre optic reflectance spectroscopy, transparency about methods and limits builds trust in South Africa’s labs and field environments!
Common pitfalls and mitigation strategies
In the quiet, cobalt-shadowed rooms of South Africa’s labs, data analysis, modelling, and interpretation in fibre optic reflectance spectroscopy translate whispers of light into tangible insight. The aim is not pure precision but honest storytelling—where structure, chemistry, and context converge, and where every decision gates what remains hidden by noise.
Common pitfalls and mitigation strategies:
- Overfitting to noise: guard with cross-validation and independent test sets.
- Preprocessing choices that erase signal: standardise, document, and test impact.
- Reliance on a single model: benchmark alternatives and review diagnostics.
- Calibration drift and transfer gaps: schedule regular cross-instrument checks across environments.
When uncertainty is acknowledged and propagated, spectral results stay grounded—in fibre optic reflectance spectroscopy, the truth wears its evidence on its sleeve.
Implementation considerations and best practices
Choosing light sources and detectors
In the lab’s quiet hum, a single choice can tilt an entire spectrum. “Light is data you can trust,” a seasoned spectroscopist likes to say. For fibre optic reflectance spectroscopy, the right light source and detector pairing turns uncertainty into actionable insight.
Implementation hinges on stability, range, and response. Light sources and detectors must be matched for the material under study, with priority on spectral coverage, linearity, and low noise. Consider the following practical points:
- Wavelength coverage aligned with the material’s spectral features
- Stability and linearity across measurement sessions
- Detector noise, dynamic range, and spectral response
- Availability, local support, and service in South Africa
With these guardrails, data credibility emerges from well-measured optics and reliable interfaces. When SA projects move from bench to field, rugged optics and mindful maintenance become as critical as the data itself in fibre optic reflectance spectroscopy.
Probe design, sample contact, and measurement ergonomics
In the field and in the lab, probe design is a quiet negotiator between light and human touch. For fibre optic reflectance spectroscopy, the interface you hold is as decisive as the spectrum you collect. A compact, rugged probe with mating geometry for stable contact turns variables into reliable baselines, even under the South African sun.
- Probe geometry that supports stable, repeatable contact across varied sample surfaces
- Rigid, strain-relieved cables to preserve optical alignment during field movement
- Cleanable, non-reactive contact tips to minimize contamination and stray light
Ergonomics matter: comfortable grips, balanced weight, and intuitive handling reduce fatigue in long sessions. I design for touch and tempo—consistent distance, angle, and alignment become second nature, especially in field sites where conditions shift.
Calibration, maintenance, and quality control programs
For fibre optic reflectance spectroscopy, reliability rests on calibration, maintenance, and quality control programs built to endure the realities of field work and lab benches alike. Calibration isn’t a one-off checkbox; it’s a living standard, anchored to reference materials and traceability that travels with the instrument. Maintenance isn’t cosmetic; it preserves alignment, prevents drift, and keeps stray light out of the signal. Quality control programs turn variability into a manageable factor, letting teams separate real signals from artefacts!
- Calibration governance and traceability across instruments and sites
- Maintenance scheduling and records to preserve optical alignment
- Quality control metrics and independent verification to monitor drift
With clear ownership and accessible records, teams in South Africa can sustain performance from remote field sites to busy laboratories. The result is data you can trust under the sun-bleached conditions of the Karoo or the bright laboratories of Cape Town.
Safety, data management, and regulatory considerations
Reliability in the field starts with discipline, not luck. In South Africa, teams that bake safety, data governance, and regulatory awareness into every workflow cut downtime and rework substantially. The big payoff isn’t flashy gadgets; it’s consistent records, traceable decisions, and clear ownership—from remote Karoo camps to the bustle of Cape Town labs.
- Safety protocols and PPE
- Data governance and version control
- Regulatory alignment and documentation
In fibre optic reflectance spectroscopy, safety training covers handling probes, eye protection around light sources, and spill procedures for any reference materials. Data management hinges on audit trails, versioned datasets, and secure backups that survive power outages. Regulatory considerations demand compliance with local standards and transparent project documentation. Together, they convert field realities into dependable data under the African sun.
0 Comments